I opened my trading dashboard today and noticed something new sitting right where the commodity charts usually live: full sector indices. SpreadCharts added them, and if you trade ETFs or just like keeping an eye on which parts of the market are moving, this is worth a look.
Here is what I found after clicking through the update.
What Changed
The app already tracked stock indices, currencies, and interest rates. Now it covers all the S&P sectors plus key sub-indices like Biotech, Semiconductors, and Oil & Gas. You can find them under the new Sector indices group in the search field.
{{image:cover.webp}}
All contract specs are on the CME Group page if you need to dig deeper.
Five Ways I Use This Data
1. The Consumer Discretionary / Staples ratio
This one acts as a pulse check on the broader US economy. When the ratio weakens, it has often marked the start of major corrections — like this spring.
{{image:image-01.webp}}
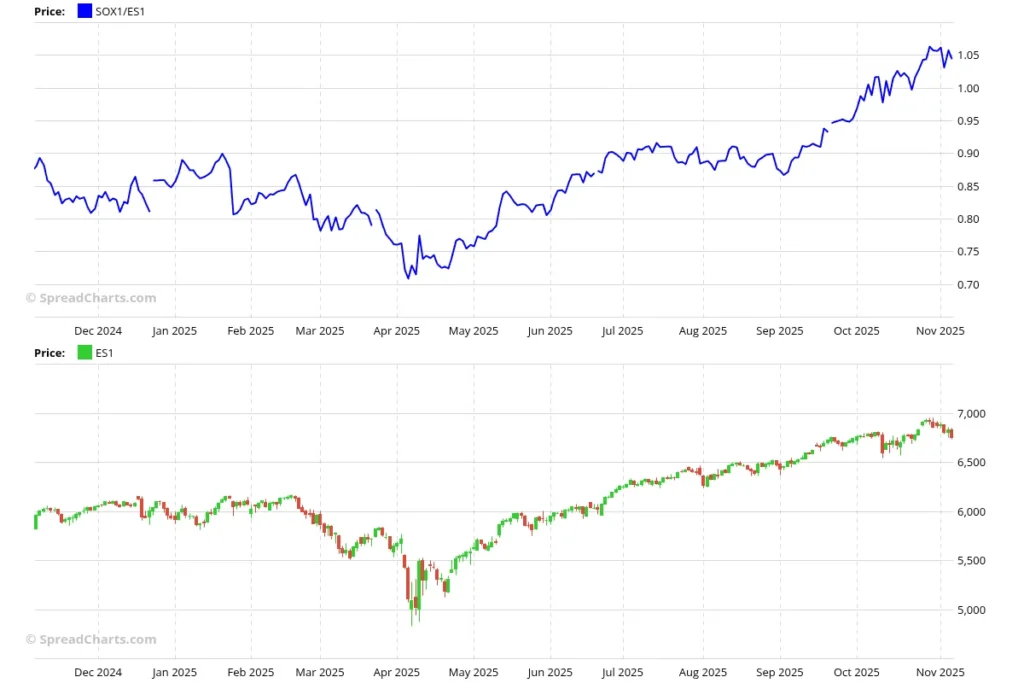
2. Semiconductors vs. the broad market
Semiconductors are basically modern oil for the information economy right now. When this ratio starts to wobble, you better be careful.
{{image:image-02.webp}}
3. Crude oil against Oil & Gas
Comparing crude with the Oil & Gas sector index gives insight into whether energy stocks are outperforming or lagging raw commodity prices.
{{image:image-03.webp}}
4. Tracking US real estate long-term
The Dow Jones Real Estate index makes it easy to follow property sector performance without pulling up a separate report.
{{image:image-04.webp}}
5. Commitments of Traders data
Most of these futures now come with CoT data built in — the Utilities sector is a good example to check out first.
{{image:image-05.webp}}
Worth It?
Worth it. Sector indices are exactly the kind of dataset that turns a basic charting app into something you can actually plan trades around. And SpreadCharts made these available without charging extra.
Frequently Asked Questions
Which sectors are covered?
All S&P sectors plus Biotech, Semiconductors, and Oil & Gas sub-indices.
Is CoT data available for every sector?
Most of these futures include Commitments of Traders data. Check the Utilities sector as a starting point.
Where do I find contract specifications?
The CME Group page has all the details.
A note from Dana: I trade sector ETFs regularly, and having these indices side by side with commodity data saves me a tab or two every morning. More datasets are on the way — keeping an eye out for what comes next.